Debugging with IntelliJ
Debugging allows you to interrupt Excel while it’s running your code by setting breakpoints, allowing you to step through the code and inspect variables.
A breakpoint in the source code specifies where the execution of the program should stop during debugging. Once the program is stopped you can investigate variables, change their content, etc.
Debugging support for IntelliJ in Jinx
Jinx allows you to specify the Java options used when it initializes the JVM. These are set in the JAVA section of the jinx.ini config file.
Debugging with IntelliJ requires the following JVM option to be set. When set, the JVM listens for debuggers trying to connect (attach) to it. You must set this option in your own jinx.ini file.
[JAVA]
java_opts = -agentlib:jdwp=transport=dt_socket,address=5005,server=y,suspend=n
The agentlib option has some additional parameters that control how the debugger will behave. For example, if you wanted to use a different port to connect IntelliJ to Excel you would change the address parameter above. The default port used by IntelliJ is 5005.
The debugger can suspend the JVM when starting by setting suspend=y. This can be useful if you don’t want any code to run before you have attached the debugger.
To set multiple Java options, put each option on a separate line in the config (as shown in the example jinx.ini file).
See the Configuration section of the user guide for more information about configuring Jinx.
Configuring IntelliJ for Remote Debugging
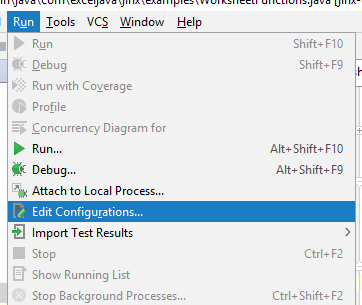
Select the Run→Edit Configurations… from the menu bar in IntelliJ.
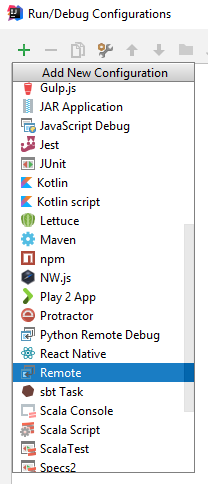
Click the green plus button and select Remote from the drop down list.
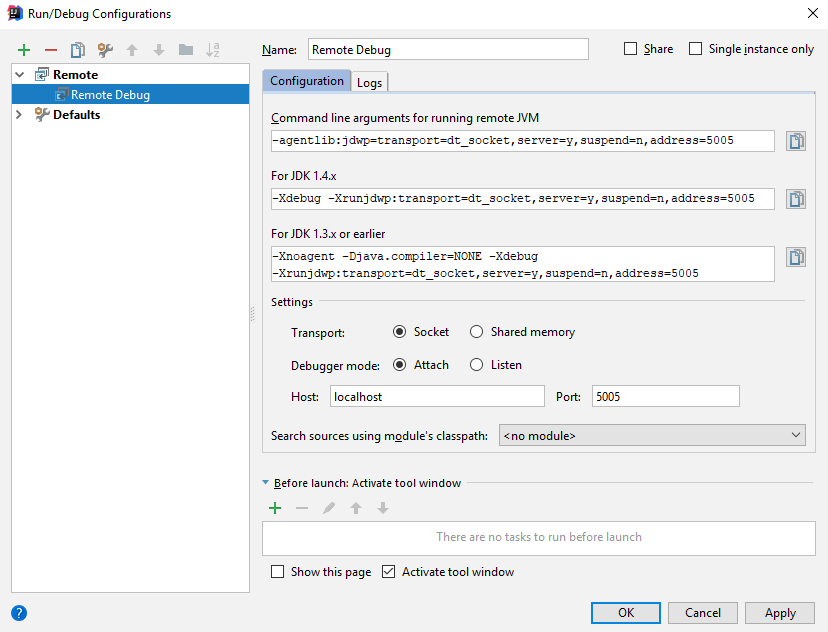
In the Name section give the debugging configuration a name so you can identify it easily later.
The Command line arguments for running remote JVM are the same as the Java options configured in jinx.ini above. The port must match the port used in the jinx.ini Java options. By default it will be 5005.
Press OK to save the debugging configuration.
Attaching the Debugger
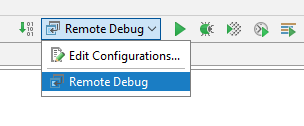
Now you have the debugging configuration saved, select it from the Run/Debug Configurations in IntelliJ.
Before you can start debugging make sure Excel is running. If Excel was already running when you made the changes to your jini.ini file you will need to restart Excel (reloading the Jinx add-in is not sufficient after a change to the Java options).
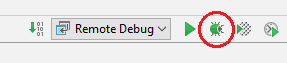
With Excel running, attach the debugger by pressing the Debug button in IntelliJ.
With the debugger successfully attached Excel will be suspended whenever any of your breakpoints are hit, and you can debug your code in exactly the same way you would usually when debugging with IntelliJ.
Rebuilding and Reloading
When you make changes to your project and want to test those changes out in Excel, you do not need to restart Excel.
Make sure you have the shadow_path set in your jinx.ini file (see Configuration). This copies all of your jar files listed on the classpath to a shadow folder, enabling the original jars to be overwritten when you rebuild your artifacts.
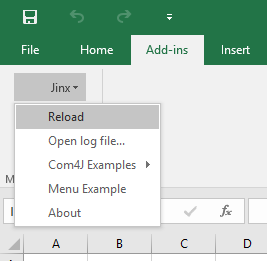
Once you have rebuilt your project artifacts you can tell the Jinx add-in to reload your jar files by selecting the Reload menu item from the Jinx menu, which you can find in the Add-Ins tab in Excel. If that tab doesn’t exist, right click on the ribbon and go to Customize the Ribbon, and in there you can add the Add-Ins tab to your ribbon.